 Seller OS
Fiverr impressions vs clicks vs orders
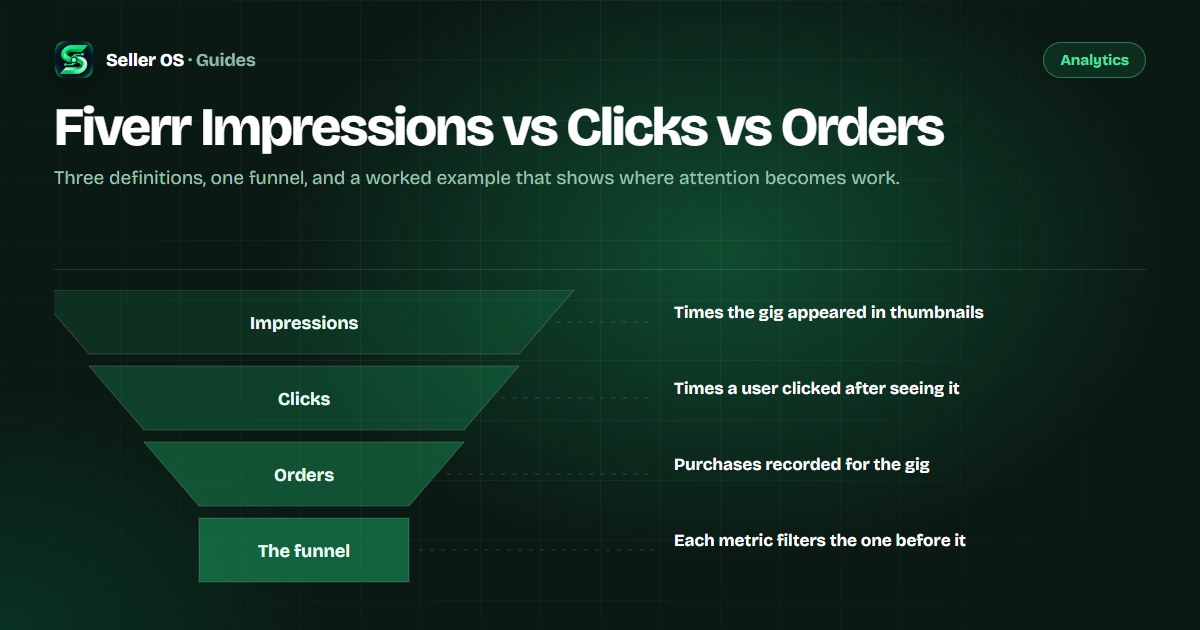
Fiverr impressions, clicks, and orders are the three traffic statistics on every gig, and Fiverr defines each one precisely: impressions are gig appearances in thumbnails across Fiverr, clicks are clicks on your gig after it was seen, and orders are purchases recorded on the gig. Together they form a funnel from being seen to being hired.
This guide gives you Fiverr's own definitions, the funnel logic that connects the three numbers, a worked example on clearly hypothetical figures, and a measurement habit that keeps them from being read in isolation. There is no benchmark here, because Fiverr does not publish one.
Free plan available. Local-first data. Human review on every change.
How Fiverr defines each metric
Fiverr's help center defines impressions as the number of times your gig appeared in Fiverr thumbnails, including the homepage, category and subcategory pages, search results, and user profile pages. Clicks are the number of times a user clicked on your gig after seeing it on one of those surfaces.
Orders are purchases recorded on the gig. Fiverr also documents a separate Views metric in its app dashboard article, defined as the number of page views on the actual gig page, and that article describes conversion as orders resulting from clicks after views. The desktop pages do not define views, so treat the mobile definition as specific to the app.
The per-gig panel pairs these counts with a conversion rate, defined on the dashboard as orders divided by impressions. The conversion rate guide unpacks the several conversion definitions Fiverr uses and when each one applies.
The funnel those three numbers describe
Impressions happen when your gig card appears. Clicks happen when a buyer decides the card is worth opening. Orders happen when everything after the click holds up: the page, the packages, the proof, the conversation, and the price. Each step loses people, and each loss has a different cause.
That means the three numbers are not three scores; they are two transitions plus an outcome. The impressions-to-clicks transition belongs to the card. The clicks-to-orders transition belongs to the gig page and the offer. Diagnose at the transition, not at the totals.
| Symptom | First metric to read | Likely layer |
|---|---|---|
| Plenty of impressions, few clicks | Clicks divided by impressions | Card: image, title, price shown |
| Plenty of clicks, no orders | Orders divided by clicks | Page, offer, proof, conversation |
| Very few impressions overall | Impressions | Visibility: keywords, tags, category |
| Impressions steady, orders falling | Orders and cancellation rate | Demand mix or delivery issues |
A worked example, clearly hypothetical
Suppose a gig records 4,000 impressions and 60 clicks in 30 days. The click share is 60 divided by 4,000, or 1.5 percent. Three orders from those 60 clicks is 5 percent of clicks, and three orders from 4,000 impressions is 0.075 percent, which is the number the dashboard calls conversion rate.
Now suppose the next month brings 5,000 impressions, 70 clicks, and four orders. Dashboard conversion rises to 0.08 percent, clicks grew, and impressions grew faster. Nothing here is a target: the point is the method. Compute both transitions, label the window, and compare like with like.
If clicks rose but orders stayed flat, the card improved and something after the click did not. If impressions rose while clicks fell, the gig is probably appearing in broader placements. Each pattern points at a different fix.
Which metric moves first, and why
Visibility changes move impressions first. A keyword edit, a new tag, a category shift, or a seasonal demand wave can change how often the card appears before anything about the card itself changes. Read those changes across a full 30-day window, because Fiverr shows statistics for the past 30 days by default.
Card changes move clicks first: a new thumbnail or title can raise clicks without touching orders yet. Page and offer changes move orders last, because they act on buyers who already clicked. Reading a click change as proof that an offer improved is the classic mistake.
One sequence to remember: impressions respond to visibility, clicks respond to the card, and orders respond to everything after the click. When two metrics move together, suspect the layer they share; when they move apart, the earlier metric usually says the most about placement.
What these three numbers cannot tell you
Impressions are appearances, not unique people. Fiverr's definitions count the times a gig appeared, so the same buyer can contribute more than once, and there is no published deduplication into visitors. Clicks say nothing about who clicked or where on the page the click happened, and the standard panel does not attribute traffic by source.
The panel also does not publish how often the numbers refresh, and the desktop and mobile help articles disagree about what the app shows. When two official pages conflict, the honest move is to trust your own consistent sampling rather than a claim about how live the panel is.
- Impressions are not unique visitors
- Clicks are not buyers
- Orders do not show which step earned them
- The standard panel does not show traffic sources
A measurement habit that stays honest
Decide the window before you look, and keep it constant: same length, same definitions, same day of the week. Write the raw counts down rather than only percentages, because percentages hide the sample size that tells you whether a change is readable at all.
Record raw counts
impressions, clicks, and orders for the window
Compute both transitions
clicks per impression and orders per click
Change one thing
and only one — before the next window
Compare equal windows
and ignore a difference that does not repeat
Where Seller OS helps
Seller OS is built around the funnel view rather than the totals. Reports and the action queue show the numbers you chose to track next to a short list of proposed actions, so a read ends in one next step. The Gig Performance Optimizer reviews a live gig's copy, gallery, and conversion signals against the gig's own performance data when you want the page and offer examined.
Everything stays local in Chrome storage, and nothing is sent, published, or edited on its own: the optimizer proposes, and you approve every change before it reaches Fiverr. It also does not replace Fiverr's own analytics, which remain the source of the raw counts.
Fiverr Impressions vs Clicks vs Orders questions
Are Fiverr impressions the same as unique visitors?
Fiverr defines impressions as the number of times your gig appeared in thumbnails across the homepage, category pages, search results, and user profile pages. That wording counts appearances, not people. Fiverr does not publish a unique-visitor version of the metric, so do not treat impressions as a headcount of distinct buyers.
Why do clicks and orders move in different directions?
They measure different transitions. A broader placement can raise impressions while click share falls; a strong thumbnail can raise clicks while orders stay flat because the page or offer does not convert yet. Read the ratio that matches the symptom instead of the raw totals alone.
Where do I see impressions, clicks, and orders?
They sit in the statistics panel of each gig, reached through My Business, then Gigs, then the gig title. Fiverr displays the past 30 days by default, and the graph switches between impressions, clicks, orders, and conversion rate. Fiverr documents the full panel for desktop browsers.
Is there a healthy clicks-to-orders number to aim for?
Fiverr publishes no benchmark, and a universal target would mislead because categories, prices, and buyer mixes differ. The useful comparison is your own gig against its own previous windows. Compute both transitions, keep the window length stable, and judge direction rather than a number from someone else's account.
See the funnel, not the totals
Record impressions, clicks, and orders for one window, then fix the transition that broke.