 Seller OS
Fiverr conversion rate explained
Fiverr conversion rate is not one number. The per-gig dashboard defines it as orders divided by impressions; Seller Plus reporting describes how often clients ordered after clicking; and the app describes conversion as orders resulting from clicks after views. The same gig can look very different under each definition.
This guide separates the definitions, shows which question each one answers, works through a labeled hypothetical example, and explains why low-volume reads deserve caution. It does not use a benchmark, because Fiverr does not publish one.
Free plan available. Local-first data. Human review on every change.
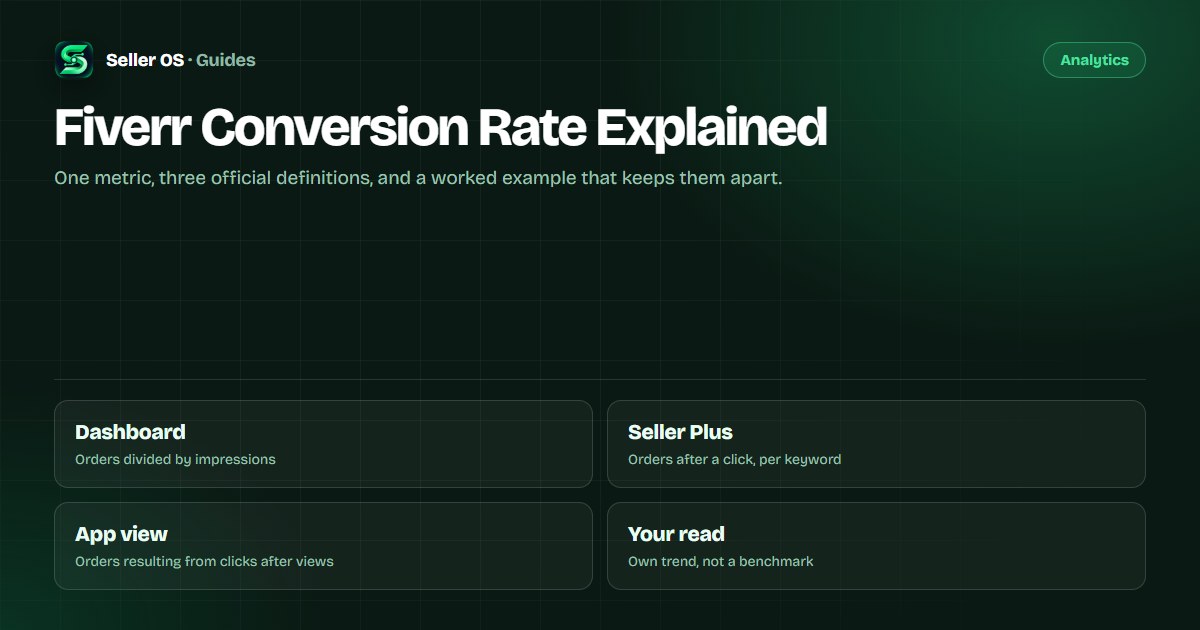
Three conversion figures Fiverr publishes
The per-gig panel states that conversion rate is calculated by dividing the total number of orders by the total number of impressions for the gig, and its FAQ repeats the same formula. That is the definition most sellers see first.
Seller Plus reporting defines conversion differently. The Top Keywords table describes CR as how often clients placed an order after clicking your gig for that keyword, and the Gig Performance view describes conversion as the percentage of clients who placed an order after clicking on your gig page.
The app dashboard article uses a third phrasing: conversion is the total number of orders resulting from clicks after views, with views defined there as page views on the actual gig page. Fiverr does not merge these into one formula anywhere, so your reading should not either.
Keeping the source label attached matters when you compare months. A dashboard conversion of 0.05 percent and a click-based reading of 3.3 percent can both be true for the same gig in the same window, and quoting the wrong one against your own history manufactures a trend that never happened.
Which definition answers your question
Use the dashboard formula when the question is about demand and placement. Orders divided by impressions asks how often the gig's appearances turn into orders, which blends the card and the page into one number. It can fall when a broad placement adds impressions from lower-intent buyers.
Use the click-based reading when the question is about the page and the offer: how often did someone who clicked decide to order? That isolates the part of the path you control most directly. The impressions vs clicks vs orders guide maps both transitions.
A quick way to keep them apart: the dashboard figure moves with visibility, and the click-based figure moves with the page. When the two disagree, the disagreement is itself the diagnosis, and a placement change usually explains it before a design change does.
The definition you choose also sets what a win looks like. For the dashboard figure, a win can come from better visibility as well as a better page; for the click-based figure, the win has to come from the page, the packages, the proof, or the conversation. Choose the definition before the fix.
Sample size honesty at low volume
Fiverr publishes no minimum sample and no benchmark, so there is no official answer to how many impressions make a conversion rate trustworthy. What is certain is arithmetic: a rate built on two or three orders swings widely when one order appears or disappears.
Hypothetical example: a gig with 900 impressions and one order reads 0.11 percent; with two orders it reads 0.22 percent. The metric doubled and nothing about the gig changed. At that volume, read the raw counts and the direction across several windows instead of the percentage alone.
The same arithmetic applies to click-based readings. Three orders from 20 clicks is 15 percent, and one order from 20 clicks is 5 percent; both numbers come from a sample too small to carry a trend. Longer windows, or several of them, beat a sharper-looking percentage.
A worked example, clearly hypothetical
Take a gig with 6,000 impressions, 90 clicks, and three orders in 30 days. The dashboard conversion rate is 3 divided by 6,000, or 0.05 percent. The click-based reading is 3 divided by 90, or about 3.3 percent: two very different stories from the same month.
Now change one thing and recompute both. Suppose the next window brings 6,400 impressions, 120 clicks, and five orders. Dashboard conversion rises to about 0.08 percent, and the click-based reading rises to about 4.2 percent. Both improved; the click-based move is easier to attribute to the page, while the dashboard move still includes placement.
The math is deliberately simple. Pick the definition, label the window, and compute both transitions every time, because a percentage without its window and its denominator is not a reading.
What conversion rate cannot tell you
A conversion rate does not identify the buyer. The same figure can come from ten committed clicks or from a hundred distracted ones, and Fiverr's standard per-gig view does not publish traffic-source attribution. Seasonality, promotions, coupons, and brief-driven traffic change the mix without touching your page.
The rate also reflects Fiverr's own ordering and personalization, which vary by buyer and search. That is why a dip is not proof of a page problem. Fiverr's keyword guidance asks for at least 30 days before reviewing impact, and the same window suits a conversion read.
None of this makes the metric useless; it makes it conditional. A conversion rate is a statement about one window on one gig under one set of conditions, and it means the most when those conditions are written down beside it.
Use it as a per-gig trend, not a target
Keep one definition per gig, one window length, and one change per window. Write down the raw counts and both transitions; when a change lands, repeat the window before trusting it. Conversion moves slowly enough that a second window is cheap insurance against a lucky month.
When a second window confirms the move, keep the reasoning beside the number: what you changed, what you expected, and what actually happened. That note is what makes next month's comparison meaningful instead of another guess.
Pick the definition that matches the question
Keep the window length identical between reads
Change one thing
page, offer, or price, never all three
Repeat the result in a second window before calling it a win
Where Seller OS helps
Seller OS puts the conversion readings in context. Reports and the action queue keep a gig's counts and proposed changes together, and the Gig Performance Optimizer reviews a live gig's copy, gallery, and conversion signals against the gig's own performance data, so a click-based dip gets traced to the layer it came from.
Package pricing review runs with guardrails, including profit assumptions and a record of recently applied prices, because price is the lever that moves clicks and conversion at once. The tool proposes; you approve every Save, Continue, or Publish yourself, and the data stays in Chrome local storage.
Fiverr Conversion Rate Explained questions
How is Fiverr's conversion rate calculated?
Fiverr publishes more than one formula. The per-gig panel defines conversion as total orders divided by total impressions; Seller Plus reporting describes how often clients ordered after clicking; the app describes orders resulting from clicks after views. Attribute whichever number you quote to the view it came from, because they are not interchangeable.
What is a good conversion rate on Fiverr?
Fiverr does not publish a benchmark for standard accounts, and a universal figure would mislead across categories, prices, and placements. Judge your own gig against its own previous windows, using the same definition and window length each time, and treat any single reading at low volume as noise.
Why does my conversion rate differ between Fiverr pages?
Because the definitions differ. Orders divided by impressions, orders after clicks, and orders resulting from clicks after views use different denominators and describe different steps. The dashboard figure includes placement effects, while the click-based figure isolates the page and the offer. Neither is wrong; they answer different questions.
How long before a conversion change is readable?
Fiverr's keyword guidance asks for at least 30 days before reviewing impact, and the same window suits conversion reads. At low volume even 30 days can be thin, so repeat the window and look for movement that survives it before acting on it.
One definition, one window, one change
Pick the conversion figure that matches your question, then read it per gig across equal windows.