 Seller OS
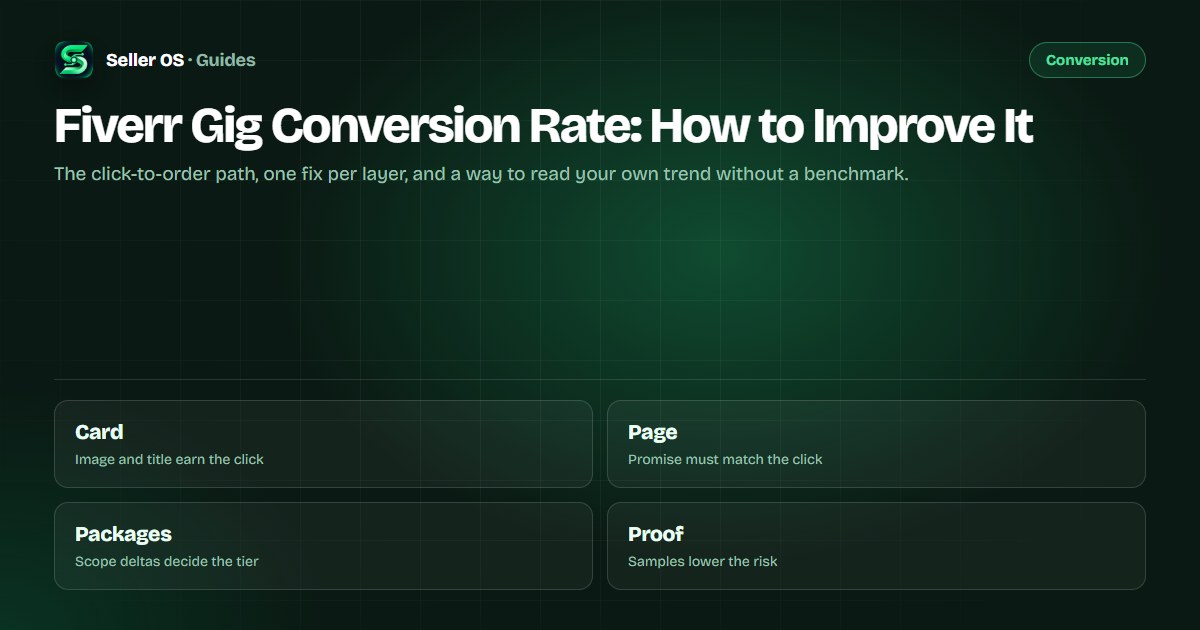
Fiverr gig conversion rate: how to improve it
Fiverr shows conversion in your per-gig statistics, and it defines the figure in more than one place. The standard dashboard calculates orders divided by impressions for the gig, while Seller Plus reporting describes conversion as how often clients ordered after clicking. Both are useful, and they answer different questions about the path from click to order.
This guide walks that path layer by layer — card, gig page, packages, proof, conversation, checkout — and gives one concrete fix for each. It also covers how to test a change without confusing it with seasonality, a price edit, or a sample that is simply too thin to read.
Free plan available. Local-first data. Human review on every change.
What your gig conversion rate measures
The number on your gig page is orders divided by impressions, per Fiverr's Managing your Gigs article — the share of times your gig appeared that ended in an order. Seller Plus reports a related but different figure: how often clients placed an order after clicking your gig.
Neither is wrong; they measure different steps. The dashboard figure rewards getting seen by the right buyers, and it can fall when a broad placement adds impressions. The click-based figure isolates what happens after someone shows interest. Use the first for demand and placement questions, and the second for page and offer questions.
Whichever figure you use, avoid converting it into a target someone else quoted. The point of the number is comparison against your own past, and its value collapses the moment it becomes a score to hit. Baselines are more useful than targets here. The metric itself is defined on the Fiverr conversion rate page.
The path from click to order, layer by layer
Every layer filters a different buyer. A click says the card worked. The page has to confirm the click was not misleading. The packages have to fit the job the buyer actually has. Proof has to reduce the risk of paying a stranger. The conversation has to remove whatever doubt remains. Then the checkout confirms the total.
The sequence is not a checklist to run top to bottom; it is a way to locate the leak. Fixing a checkout confusion does nothing if the page top already loses the buyer, and optimizing the card does nothing if the packages cannot fit the job the click promised.
Each layer also has a different cost to fix. Copy and structure changes are free and quick; price changes touch margin; response habits take discipline over weeks. Start with the cheapest layer that matches the symptom, and let the harder changes wait for evidence.
| Layer | What the buyer decides | One fix |
|---|---|---|
| Gig card | Is this worth opening? | Make the image and title match one query |
| Page top | Is this what I clicked for? | Open with the outcome, not your bio |
| Packages | Which tier fits my job? | Give the middle tier the common case |
| Proof | Can this seller deliver? | Show samples that match the package |
| Conversation | Will answers come fast? | Answer the blocking question first |
| Checkout | Is the total acceptable? | Explain extras before the order screen |
Read your own trend, not a benchmark
Fiverr does not publish a conversion benchmark to compare against, and a universal number would be misleading anyway: conversion depends on category, price level, and the mix of buyers who saw the gig. The honest comparison is your gig against its own past, measured the same way each time.
Worked example, hypothetical. A gig records 400 impressions, 20 clicks, and 4 orders in 30 days. Under Fiverr's dashboard definition that is an order for every 100 impressions, and four orders for 20 clicks. The precise percentages matter less than the method: same metric, same window length, before and after a single change.
Because no benchmark exists, your first job is to establish a baseline before you change anything. Record two or three undisturbed windows of the same length, so the normal range of the metric becomes visible. A change that lands inside the normal range has not been demonstrated yet.
Compare only like with like. Orders per hundred impressions from a month with a promotion is not comparable to a quiet month, and clicks from a category placement are not comparable to clicks from a typed query. If the conditions changed, the comparison changed too.
Change one layer per test window
Conversion is a chain, which is why changing three layers at once teaches you nothing. Pick the layer with the clearest symptom: few clicks from many impressions points at the card; plenty of clicks with no orders points at the page, the offer, or the conversation.
Then change one thing and hold everything else: same price, same images, same title. Two to four weeks gives a small gig enough traffic for a readable comparison. If the gig only collects a handful of clicks a week, lengthen the window instead of lowering your standards.
Window length should follow traffic, not enthusiasm. A gig with steady interest can read a change in two to four weeks; a quiet gig may need a month or more, and even then the honest answer is directional. Decide the window before the edit, not after the numbers arrive, so you cannot move the goalposts.
Write down the symptom
the layer where the ratio breaks
Choose one fix
the smallest change that could move that layer
Freeze the rest
no price, image, or copy edits during the window
Compare equal windows
same metric, same length, before and after
What makes conversion data lie
Small samples produce confident nonsense: five clicks and zero orders next to ten clicks and one order looks like a collapse and is actually noise. Seasonality moves demand under you. A price change is itself a conversion experiment and cannot be combined with a copy test. And a promotion can send a different kind of buyer to the same page.
The fix is not more data; it is cleaner comparisons. Same window length, one change, a stable price, and a note about anything unusual — a holiday week, a paused ad campaign, or a stretch where you were answering messages slowly.
Promotions and briefs change the composition of your audience as well. A discount-driven buyer and a brief-driven buyer arrive with different budgets and expectations, and both can shift a ratio without the page changing at all. Note the traffic source in your log whenever it moves.
The deliberate response is to keep the baseline visible. When a ratio falls, check the traffic source first and the page second. If the source changed, fix nothing and wait; if the source is stable, you have probably found the layer worth testing.
- Window lengths that differ between before and after
- A price move in the middle of a copy test
- A traffic source that changed mid-window
- A sample too thin to separate signal from luck
Improve conversion without gimmicks
The durable levers are unglamorous: name the exact outcome, show work in the buyer's format, make the middle package the obvious fit, answer questions in the order they arrive in your inbox, and keep response time short. None of that requires inventing proof or overpromising what you deliver.
Price deserves its own window. A price change moves conversion and earnings at the same time, so judge it on revenue per hundred impressions rather than conversion alone, and keep the old price saved in case the read goes the wrong way. Margin context belongs next to every price decision.
Finally, bank the wins you find. When a scope rewrite or a proof fix moves the number in a repeatable way, write down the reasoning, not just the change, so your next gig benefits from the pattern instead of starting from zero.
And resist changing a win. When a fix works, the temptation is to push it further inside the same window; hold the win steady instead and let it prove itself across another window before you build on it. The pricing versus conversion guide goes deeper on the price side.
- Write the baseline down before any edit
- Note the traffic source beside the metric
- Re-run a winning change when it stops working
Where Seller OS helps
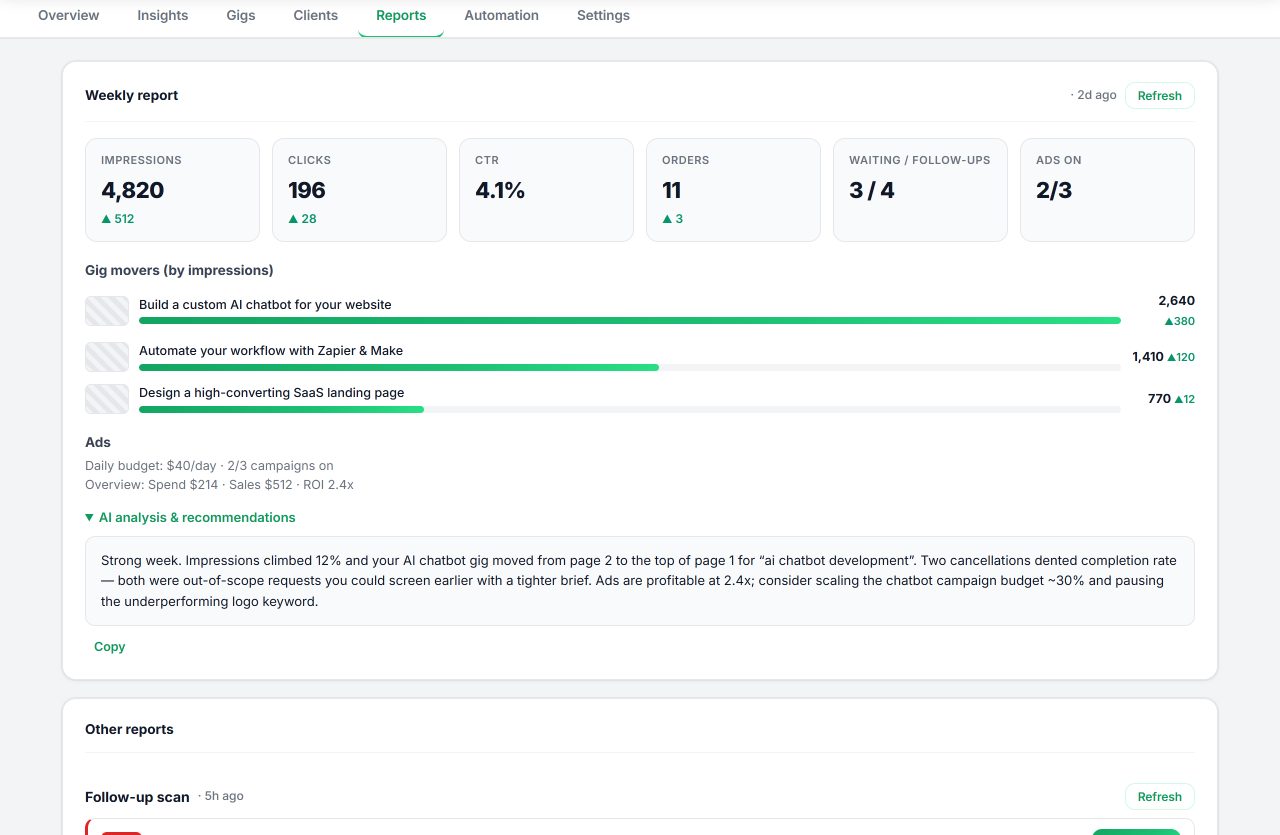
Seller OS connects the layers. The Gig Performance Optimizer reads your live gig's copy, gallery, and conversion signals against the gig's own performance data and proposes changes, so a test stays focused on one layer at a time. Local reports and the action queue keep the list of pending fixes short enough to act on.
Package pricing review runs with guardrails — profit assumptions and a record of recently applied prices — so a price test does not quietly break your margins. The tool proposes and fills nothing into Fiverr; you approve every edit before it happens.
Fiverr Gig Conversion Rate questions
What is a good gig conversion rate on Fiverr?
Fiverr does not publish a benchmark, and there is no universal good number: conversion depends on category, price, and traffic mix. The useful comparison is your gig against its own past, measured the same way. Track orders per 100 impressions over equal windows and look for direction, not a target.
Why did my gig conversion rate change without edits?
Traffic mixture and demand shift constantly, and results are personalized, so the buyers who saw your gig this month are not the same set as last month. Seasonality, a paused ad, or an unrelated category trend can move the ratio. Compare longer windows before attributing the change to your gig.
Should I change my price to improve conversion?
Price is one of the strongest conversion levers and also one of the hardest to test, because it changes earnings and buyer mix at once. If you test it, change nothing else in the same window and judge the result on revenue per hundred impressions, not on conversion alone.
How many clicks do I need before trusting a read?
There is no published threshold, but thin samples separate signal poorly: a handful of clicks will swing wildly on luck alone. Lengthen the window until the gig accumulates a reasonable number of impressions and clicks for your category, and treat shorter reads as directional at best.
Fix one layer at a time
Pick the layer where the ratio breaks, change one thing, and compare equal windows before the next fix.