 Seller OS
Fiverr gig position vs conversion rate: read both together
Rank and conversion rate answer different questions: where buyers see your gig, and what they do once they do. A better position brings more impressions, and more impressions are not automatically better buyers. That is why a gig can climb the results and still convert worse.
This guide explains how position and conversion interact, shows a worked example with two keywords labeled as hypothetical, and gives you a reading routine so one number never sends you editing the wrong thing.
Free plan available. Local-first data. Human review on every change.
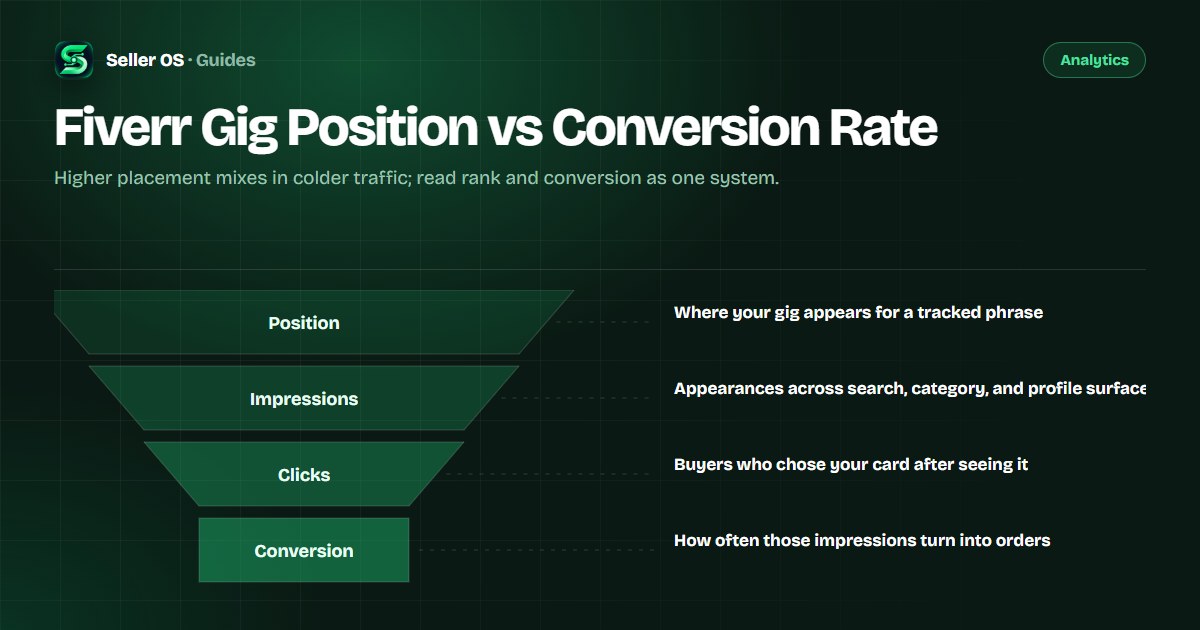
Two different measurements of the same gig
Fiverr defines impressions as the number of times your gig appeared in thumbnails, including the homepage, category and subcategory pages, search results, and user profile pages. A rank position is only one source of those appearances, and it is one you sampled with a keyword you chose yourself.
Conversion has more than one official definition too. The per-gig dashboard divides total orders by total impressions for the gig. Seller Plus views describe conversion after a click, and the mobile dashboard counts orders resulting from clicks after views. Write down which one you are reading before you compare weeks.
There is one more difference worth holding on to: a position is something you sample, while a conversion rate is something Fiverr calculates. Log positions the same way each week so the comparison is fair, and treat Fiverr's own ratio as the ground truth for what actually happened.
- Impressions: appearances across several surfaces, not only search.
- Position: a sampled estimate for one phrase, not an absolute rank.
- Conversion: one number, but three official definitions.
Why a higher position can convert worse
Higher positions usually mean more impressions, and impressions come with different levels of intent. A buyer scrolling a broad category or homepage thumbnail is earlier in the journey than someone who typed a specific phrase. When your position improves for a broad phrase, the new impressions can be colder than the ones you had before.
Suppose your gig moves from position 14 to position 6 for a broad phrase like video editing. Impressions rise, clicks rise a little, and orders stay flat. Nothing is broken: the wider audience simply includes more people who were never going to order this week, from anyone. The page is fine; the traffic mix changed.
None of this argues against ranking higher. It argues against reading a position gain and a conversion dip as a contradiction. Both can be true at once, and the fix usually belongs on the page: sharpen what the gig promises so the colder traffic has an easier yes.
How to read position and conversion together
Treat the pair as a diagnosis grid. The direction of each number tells you which layer of the funnel to inspect first. The grid below is a reading guide built from the official definitions, not a published Fiverr model.
| Position | Conversion | First thing to check |
|---|---|---|
| Up | Up | Nothing; hold the change and keep tracking |
| Up | Down | Which keywords gained impressions; broader traffic dilutes |
| Down | Up | Whether remaining traffic is more qualified; check earnings |
| Flat | Down | The gig page: promise, thumbnail, packages, price |
| Down | Down | Demand and period length before touching fields |
Worked example: two phrases, one gig
This hypothetical example shows why conversion rate needs its denominator. The gig earns the same three orders from two tracked phrases, but the traffic behind them is nothing alike.
The dashboard formula favors the specific phrase by a wide margin even though both produced three orders. The broad phrase is not useless; it builds awareness and may convert later. But the specific phrase is the one earning its keep right now, so it deserves the title and keyword attention, and it is the phrase to watch when you test a change.
Note the arithmetic: the percentages in the table use the dashboard definition, orders divided by impressions. If you instead counted orders after clicks, the comparison would change. Pick one definition and stick to it for the life of the test.
| Phrase | Impressions | Clicks | Orders | Orders ÷ impressions |
|---|---|---|---|---|
| video editing | 900 | 27 | 3 | 0.33% |
| youtube video editing | 120 | 12 | 3 | 2.5% |
Track clicks, not just the endpoints
Impressions and orders are the endpoints; clicks are the hinge. A position change that adds impressions without clicks is a relevance or thumbnail problem, and a click increase without orders is a page problem. The clicks number tells you which side of the hinge to work on first.
Fiverr shows click-through rate in its Seller Plus analytics material rather than on the standard per-gig dashboard, so sellers without Seller Plus can build their own ratio: divide clicks by impressions from the numbers shown for the gig. Use it consistently and treat it as your metric, not a platform one.
The common mistake is reading one number in isolation. Conversion rate can fall while orders and earnings rise, simply because impressions grew faster. Before you panic-edit the page, check whether the absolute orders number moved at all.
A monthly routine that keeps both numbers honest
A routine beats a reaction. Log both numbers on the same schedule, change one thing at a time, and let two full windows pass before drawing conclusions. A change that improves a position without improving orders is not a win yet; a conversion dip during a position climb is not automatically a loss.
Log positions
three to five tracked phrases, same day each week.
Pull the gig numbers
impressions, clicks, orders, and conversion for the same period.
Compare to the previous period
not to your memory of last month.
Attribute movement
identify which phrase moved before editing anything.
Change one thing
then wait for the next full window before judging.
Where Seller OS helps
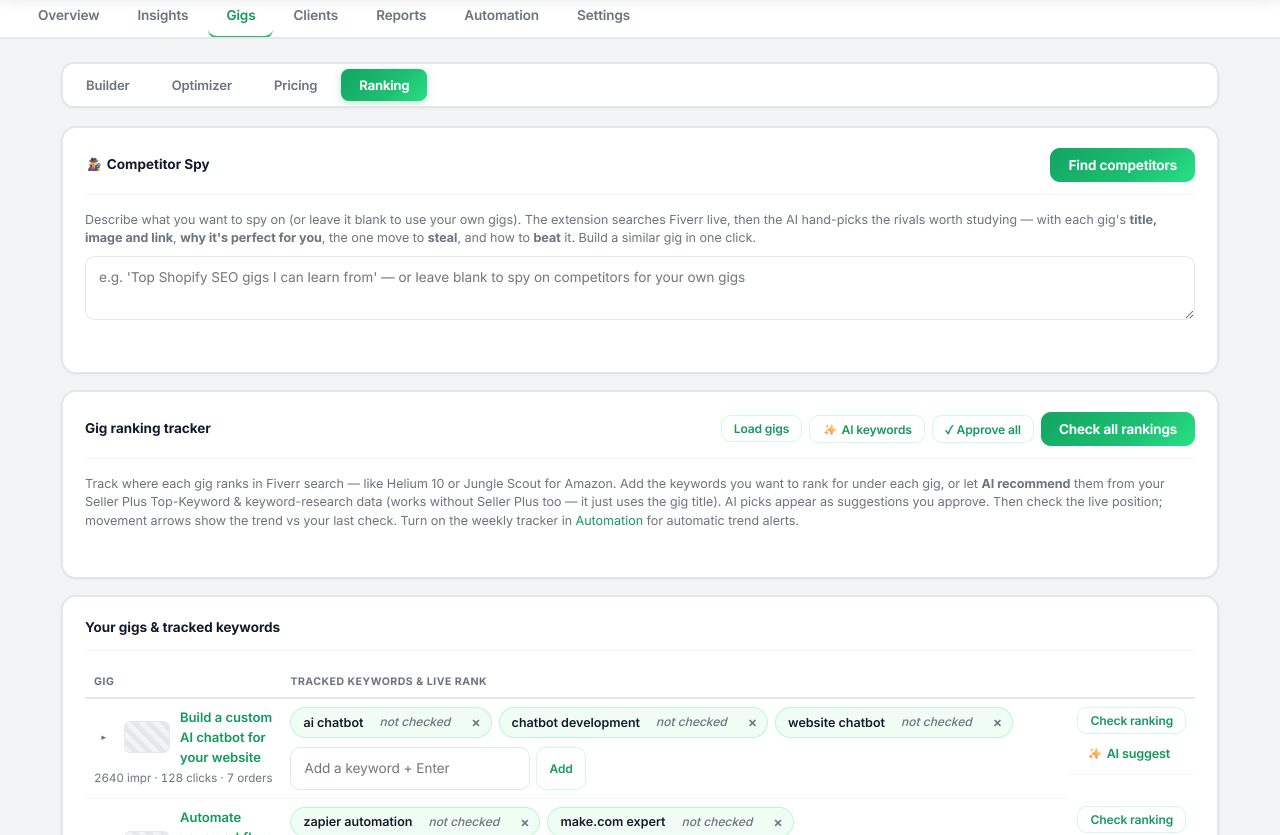
Seller OS keeps both numbers in one place: the Keyword Rank tracker records positions for the phrases you choose and the gigs around you, while the reports view pairs that movement with your gig's own clicks and orders, so a position climb and a conversion dip are visible on the same screen.
When the pair points at the page rather than the position, the Gig Performance Optimizer proposes copy and gallery changes for you to review. It records and suggests; every edit, save, and publish stays in your hands.
Fiverr Gig Position vs Conversion Rate questions
Why did my conversion rate drop when my position improved?
A better position usually adds impressions, and the dashboard conversion rate divides orders by impressions. If the new impressions come from broader traffic with less buying intent, the rate falls even when order count holds. Check which keywords gained impressions and compare orders and earnings, not the percentage alone.
Which matters more, position or conversion rate?
Neither stands alone. Position decides how many buyers see the gig; conversion decides what they do next. A high position with weak conversion is page work waiting to happen, while a low position with strong conversion is a reach problem. Fix the number that is actually blocking orders.
Does Fiverr show my click-through rate?
Click-through rate appears in Fiverr's Seller Plus analytics material, including keyword views. The standard per-gig dashboard shows impressions, clicks, orders, cancellation rate, and conversion rate. Without Seller Plus you can still divide clicks by impressions yourself and track that ratio consistently as your own metric.
How often should I compare position with conversion?
Use the same cadence for both. A weekly position log plus the gig's 30-day default statistics is enough to see patterns without overreacting. Judge changes only after two full windows, because position and conversion rarely move in the same week for the same reason.
Read the pair, not one number.
Track positions and gig numbers together, then change one thing per window with evidence behind it.