 Seller OS
Fiverr sales analytics: what should sellers track?
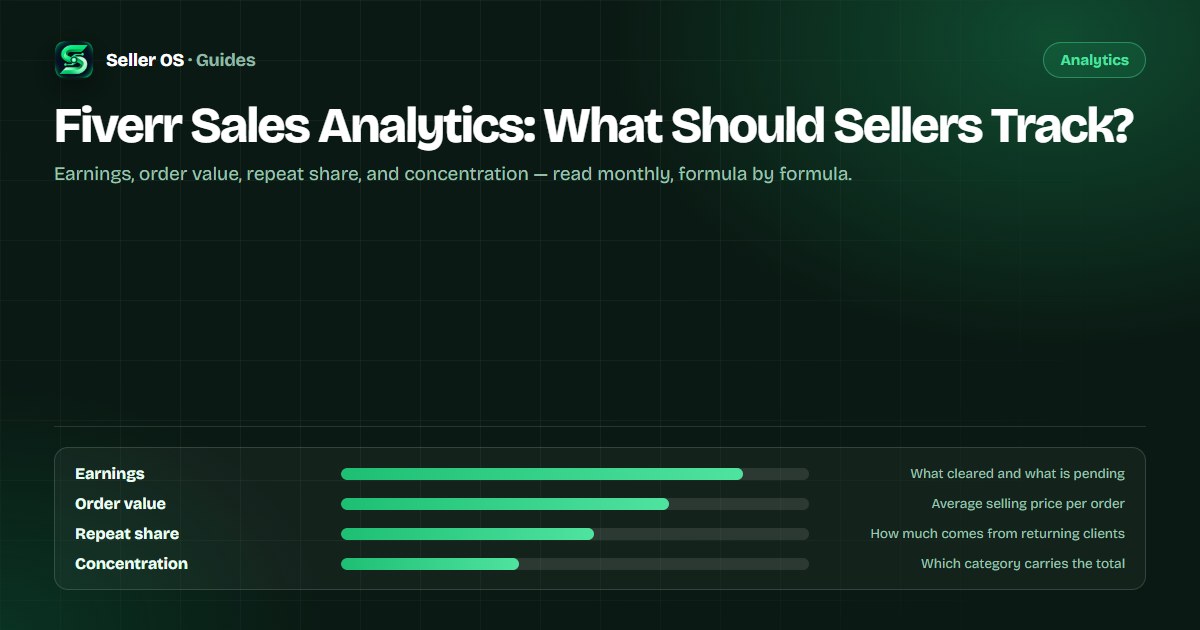
Sales analytics for a Fiverr seller means watching the business, not one listing: what you earn, what an average order is worth, how much comes from repeat clients, and where the money concentrates. Fiverr's Analytics page provides several of those numbers; the rest you track yourself, because no dashboard knows your costs.
This guide maps what the platform shows, defines the formulas as examples you can adapt, and walks a monthly review sheet you can keep in any spreadsheet. Every calculation here is an example, not a Fiverr formula.
Free plan available. Local-first data. Human review on every change.
What Fiverr's Analytics already gives you
Fiverr's Analytics page includes an Overview tab with total earnings, described as cleared payments plus Customer Support compensations, and an Average Selling Price defined as total earnings divided by the number of completed orders. It also shows total orders completed, current-month earnings entering the clearing period, a cancellations breakdown, and a world map of client countries. Fiverr documents these in Viewing your sales analytics.
Two details matter when you build your own sheet. The last 30 days are displayed by default and the range can be changed, so your monthly rows should use the same window every time. And the Sales section that once showed a timeline of earned, cancelled, and new orders no longer exists in the current Analytics page, according to its own FAQ, so do not plan around it returning.
Treat the platform view as the source for platform numbers and your sheet as the source for business ones. When the two disagree, the sheet is usually using a different window or counting work that was never completed. Note which definition each column follows, and most disagreements resolve themselves.
Repeat share and concentration matter most
Repeat business is the closest thing to a moat on a marketplace. Fiverr defines a returning client as someone who has previously purchased your service and is now requesting it again, and counts the client as a repeat buyer only after an order has been completed, not merely created. The Analytics page includes the number of repeat clients and a repeat business score comparing retention in your subcategory over 90 days.
One wording trap: the analytics page labels a metric as a percentage of orders from repeat clients but defines it as the percentage of your earnings from repeat clients out of total earnings. Fiverr's label and its definition disagree, so read the number for what the definition sentence says and keep your own repeat calculation in the sheet if you want a clean trend.
Concentration is the risk view. If one subcategory or one client carries most of your earnings, the business has a single point of failure. The monthly sheet should say so plainly, because concentration is cheap to measure and expensive to discover during a slow month.
A monthly review sheet that fits one screen
Keep one row per month with six columns: earnings, completed orders, average selling price, repeat share, top category share, and one line about what changed. Everything except the last two comes from simple formulas you control.
The reading matters more than the entries. February below earned less than January on fewer orders, but the average order and repeat share both rose; March grew on every line; April dipped slightly in total while order value and repeat share kept climbing. That is a seller moving up-market with a growing core, not a seller in decline.
Keep the change note short and specific: a price move, a new package, a pause, a promotion. Vague notes age badly, and the whole value of the column is explaining a movement months later when memory has stopped helping.
| Month | Earnings | Orders | Avg order | Repeat share |
|---|---|---|---|---|
| January | $1,240 | 31 | $40 | 18% |
| February | $1,180 | 24 | $49 | 29% |
| March | $1,530 | 30 | $51 | 35% |
| April | $1,460 | 26 | $56 | 42% |
Add the column Fiverr cannot know
Fiverr pays sellers 80% of the purchase amount, including gig extras and tips, so the earnings in your analytics are already net of the platform's share. They are not net of your costs. Software subscriptions, stock assets, contract help, and the hours you spend are real expenses, and no dashboard sees any of them.
Track two additions in the same sheet: monthly costs, and an effective hourly check for your biggest service. The first turns revenue into profit; the second stops a high-volume, low-value service from quietly eating the week. Neither number needs to be precise to be useful; it needs to be consistent from month to month. Formulas, as examples: profit equals earnings minus costs, and effective hourly equals earnings divided by hours worked.
Turning the sheet into decisions
Each monthly read ends with one business decision: raise the price on a service whose average order is rising anyway, build a repeat offer for clients who have already returned twice, rework a service that never earns its hours, or deliberately diversify when one category crosses most of your earnings.
Worked scenario, hypothetical. Repeat share climbs for three months while new-order counts slide. The decision is not more acquisition work; it is a structured repeat offer, because the sheet says the returning part of the business is already the strongest part. Fiverr counts a client as a repeat buyer only after a completed order, so those returning clients are proof, not a coincidence.
Write the decision where you will see it next month, next to the row that produced it. A decision without a follow-up date is a wish, and the sheet only becomes a management tool when each month closes the loop on the previous one.
Sales-tracking mistakes to avoid
Tracking revenue while ignoring costs is the classic mistake; it produces a business that grows on paper and pays less each month. Comparing months without normalizing for order count is the second, because one large order can move an average and get credited to pricing when nothing about your pricing changed.
The third is confusing earnings with available money. Amounts enter a clearing period, and the analytics page shows current-month earnings entering clearing, so a strong month does not mean the full amount is spendable yet. The fourth is borrowing targets from other sellers. No benchmarks are published by Fiverr, and your own history is the only honest baseline you have.
Finally, do not compare your sheet to anyone else's. Different categories, costs, and order mixes make cross-seller comparisons meaningless, and there are no published benchmarks to anchor them anyway.
- Revenue without costs is not profit.
- Normalize for order count before reading an average.
- Cleared is not the same as earned.
- Your own history is the only baseline.
Where Seller OS helps
Seller OS keeps the business view in one place: reports assemble a gig's tracked numbers into readable periods, so the monthly row is waiting when review day arrives, and the pricing review checks proposed package prices against profit assumptions and recent applied prices before you commit to them.
The action queue then turns the review into a short list of concrete steps. Nothing about it replaces your spreadsheet's cost column, and it never changes a price or publishes anything on its own; every decision and every Save stays with you, and the data stays in Chrome local storage.
Fiverr Sales Analytics questions
What should I track in Fiverr sales analytics?
Track earnings, completed orders, average order value, repeat share, and category concentration, plus your own costs. Fiverr's Analytics page supplies several of those directly, including average selling price and repeat-client numbers. The sheet adds the business context the platform cannot see, such as expenses and effective hourly value.
What is average selling price on Fiverr?
Fiverr defines Average Selling Price as total earnings divided by the number of completed orders. It is shown in the Analytics Overview tab. Treat it as a directional number and keep your own version in the sheet using the same definition each month, so a single large order does not make it look like a trend.
How often should I review my Fiverr income?
Monthly is enough for most sellers and matches the 30-day default window in the analytics. Once a month, fill one row, compare it with the previous few rows, and choose one decision. Checking earnings daily adds anxiety without adding information, because orders and clearing periods do not move on a daily rhythm.
Why does Fiverr show a percentage of orders from repeat clients?
Fiverr's analytics page includes a repeat-client metric, but its label and definition disagree: the label says percentage of orders while the definition describes the percentage of earnings from repeat clients out of total earnings. Attribute the number honestly, and if consistency matters to you, calculate repeat share yourself from your own records.
Read the business once a month.
Keep the sheet, add your costs, and end each review with one decision you can measure.