 Seller OS
How to track Fiverr gig performance over time
Tracking Fiverr gig performance means keeping a written record of the same numbers over time. The habit exists because Fiverr's per-gig statistics default to a 30-day view: check the dashboard today and last month's numbers are already being replaced by the current period, whether or not you wrote them down.
This guide covers what to log, how often, a sheet schema that fits one line per period, and how to read a history without fooling yourself. The analysis session is a separate job; this is the record that feeds it.
Free plan available. Local-first data. Human review on every change.
Why a log beats relying on memory
Memory compresses. A bad week in March fades next to a good launch in April, and by June you remember the trend you want to be true. A log keeps entries flat and comparable, which is the only way a season, an edit, or a competitor's move becomes visible as a cause instead of a feeling.
There is a platform reason too. Fiverr's gig statistics display the past 30 days by default, with arrows comparing against the previous period selected. The screen is a window, not an archive; your log is the archive. Without it, an edit made in February is judged against whatever March happens to show, which is exactly how sellers end up reverting changes that were working.
The log also protects against the most common diagnostic error: changing several fields at once and crediting whichever result you like. With dates in the log, you can see exactly what changed before a movement, and how long the gig had to respond to it.
What to log, and what to leave out
Log the numbers that answer the five performance questions: impressions, clicks, orders, conversion as shown on your screen, and one line about delivery health or score movement when something notable happened. Add the date of every change you make — a title edit, a price move, a gallery swap, a new package.
Leave out everything else. Time-of-day impressions, device splits, and vanity totals change nothing about your next decision, and every extra column makes the log heavier to keep. The metric set should fit one line per gig per period, written the same way every time.
Keep the conversion column honest by noting which definition it uses. The per-gig dashboard divides orders by impressions, while Seller Plus describes conversion per click. Pick one, label it in the header, and never mix rows that used different definitions in the same comparison.
| Column | Example entry | Why it is there |
|---|---|---|
| Period | March 1-31 | Keeps comparisons window-matched |
| Impressions | 2,480 | Answers whether the gig was seen |
| Clicks | 96 | Answers whether the card earned attention |
| Orders | 11 | Answers whether clicks converted |
| Change note | New first image on March 4 | Ties movement to a cause |
Pick a cadence you will actually keep
Monthly is the natural cadence because it matches the 30-day window the per-gig statistics use. Log at the start of each month for the month just ended, on the same day, from the same screen. If you are actively testing a change, add a weekly rank sample for the keywords in the test, but keep the main log monthly.
Daily logging is a trap. It multiplies entries without adding signal, and small samples swing hard enough to trigger edits you will regret. The log is a history tool, not a heartbeat monitor.
Set a reminder for the same date each month, and log even the boring months. A row of small numbers is still data, and gaps in the record are what force you back to guessing. Consistency is the entire product here.
- Monthly: the main metrics row for each gig.
- Weekly, only during a test: rank samples for the tested keywords.
- On every edit: a dated change note, added immediately.
- Never: daily screenshots of the same number.
Worked example: three months of history
Here is a hypothetical log for one gig across three months, with one change in the middle. The point is what becomes visible only in the sequence.
| Month | Impressions | Clicks | Orders | Change note |
|---|---|---|---|---|
| January | 1,900 | 74 | 8 | None |
| February | 1,840 | 71 | 7 | New first image, Feb 6 |
| March | 2,260 | 103 | 13 | None |
Rules for reading your own history
Three rules keep a log honest. Compare like windows: never set a 31-day entry against a 7-day one. Require two periods of agreement before calling something a trend, because one row is a data point. And separate your changes from outside movement by watching whether the rest of the category moved with you.
February looks slightly worse than January in the example above, which is exactly why single-row reading fails: the change landed on the sixth and had three weeks to work. March, the first full period after the edit, shows impressions and clicks both up and orders following. The log makes the delayed effect visible; memory would have blamed the new image for February.
When a movement appears, read the change notes before the numbers. The log is built so a cause is usually sitting one column away from the effect, and the fastest way to misread a good month is to forget which edit preceded it.
Match windows first
same number of days, same screen.
Require two periods
one row is only a data point.
Check the category
did the whole page shift with you?
Keep one edit per window
two edits make movement a mystery.
Tracking habits that quietly fail
Logs fail for boring reasons. The columns multiply until keeping them feels like a chore, so they stop. The change notes get skipped, so every movement loses its explanation. The method shifts — a different range, a different definition of conversion — and the old rows quietly stop being comparable to the new ones.
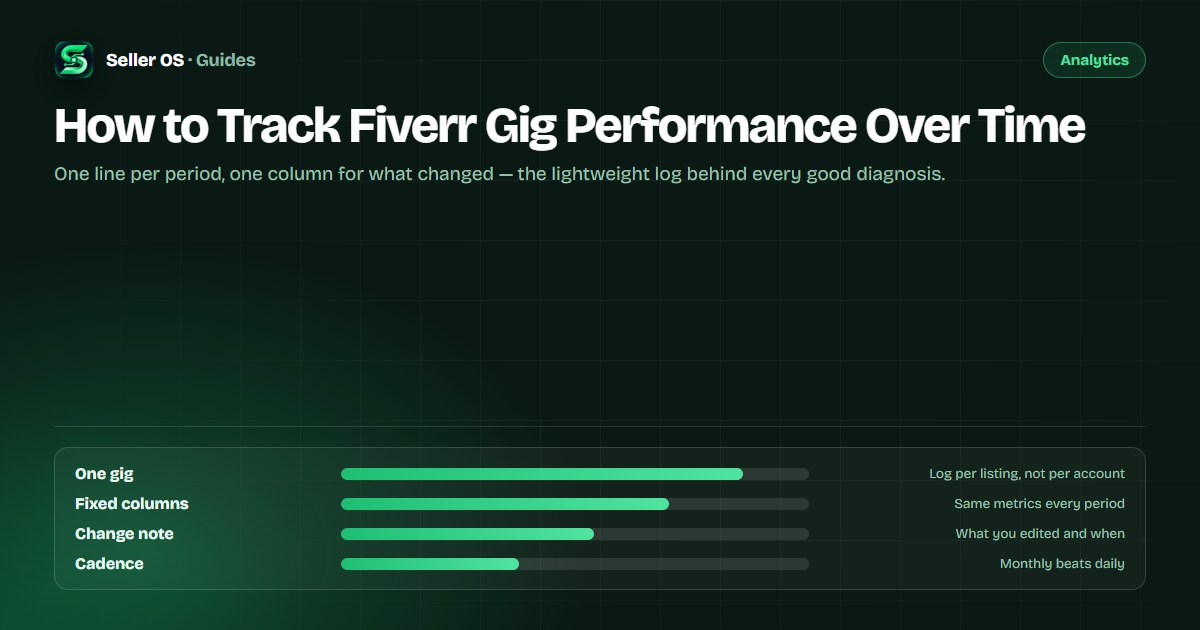
The fix is a smaller log kept for a long time: one line per gig per month, four numbers, one note, always written the same way. A modest record with ten clean months beats an elaborate one abandoned in week three, and the history only pays off if it survives past the month you started it.
Finally, do not let the log become a report for anyone else. It exists to answer your questions, not to look impressive, and every column added for appearance is a column you will eventually stop filling in.
Where Seller OS helps
Seller OS keeps the log for you. The keyword rank tracker stores local position history for the terms you track, and the report view assembles a gig's tracked numbers into a readable history, so the monthly row is already waiting when review day arrives.
Pro monitors can watch in the background while Chrome is open and flag notable movement between log entries. Everything is stored locally in Chrome; nothing is uploaded, and the extension never edits or publishes on your behalf.
How to Track Fiverr Gig Performance Over Time questions
How do I track my Fiverr gig performance over time?
Keep a simple log with one row per gig per month: impressions, clicks, orders, conversion as shown on your screen, and a note for any change you made that month. Write the date and use the same 30-day window each time. The written sequence is what lets you compare periods instead of relying on memory.
How often should I check my Fiverr gig statistics?
Once a month for the main log, because Fiverr's per-gig statistics cover a 30-day window by default. Add a weekly rank sample only while you are actively testing a keyword change. Daily checks multiply entries without adding signal and tempt you into edits based on small samples.
What numbers should I write down?
Impressions, clicks, orders, and the conversion figure your screen shows, plus one line about any edit or event that month. Those four cover traffic, attention, and conversion, and the change note explains movement. Leave out anything that does not change a decision, or the log becomes too heavy to keep.
Why is my gig history important if Fiverr shows analytics?
Because the dashboard shows a window, not an archive. Per-gig statistics default to the last 30 days, so the period you want to compare against disappears as time passes. Your own log keeps older periods intact, which is what makes it possible to judge whether an edit worked.
Write it down, then trust the rows.
Log one line per gig per month, date every edit, and let three periods tell the story.